Have you ever planned a flight into a coastal airport and wondered, “What time will this marine layer burn off if I fly in next week?” TAFs only go out a day or two in advance. If you’re planning an itinerary for next week or next month, it’s hard to know what to expect.
This predictor is my attempt to solve that problem. Given an airport of interest, it downloads historical METAR data and counts how often the airport was VFR, MVFR, IFR, or LIFR at each hour of the day. Because weather depends on the season, if you’re interested in October, the prediction is based on the last several Octobers of data. The output is a stacked bar chart showing all 24 hours of the day, color-coded to show how often each flight condition occurred during that hour.
For example, the chart below shows the prediction for Santa Monica Airport (KSMO) in June—special to me, because I learned to fly at that coastal airport in Southern California over 20 years ago and was often bedeviled by June Gloom.
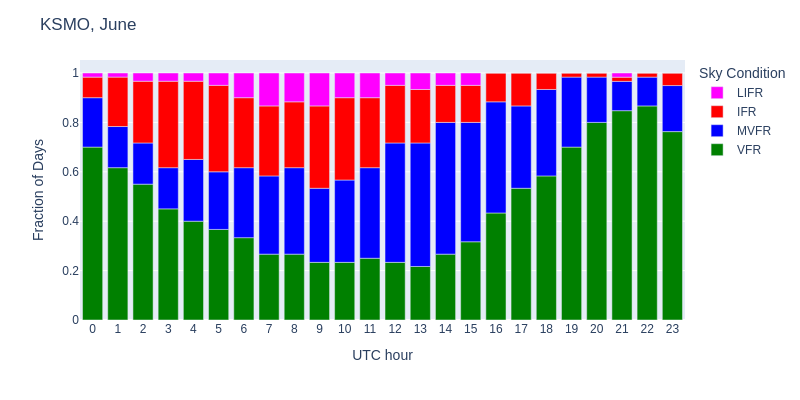
How to read the chart: Each bar represents one hour of the day (UTC). The local time is shown below each bar, and the yellow background indicates daylight hours. The height of each colored section shows the percentage of days in that month that had that flight condition during that hour. VFR is stacked on the bottom, making it easy to read—just look at where the green ends. For example, at hour 0 UTC (5 PM PDT), the VFR section reaches 77%, meaning 77% of days in past Junes had VFR conditions at 5 PM. Above that, MVFR adds 17% and IFR 7%. By hour 10 UTC (3 AM local), the VFR bar drops to just 28%, with a 72% chance of marine layer: 38% MVFR, 27% IFR, and 8% LIFR.
KSMO in June shows classic June Gloom. The best predicted conditions are from 20-22 UTC (1-3 PM local) with 81-90% VFR. The worst marine layer hits from 8-15 UTC (1-8 AM local). At the worst hours (13-14 UTC / 6-7 AM local), VFR is only 26-31%, with a 69-74% chance of marine layer: about 51% MVFR, 13-18% IFR, and 4-6% LIFR. The marine layer begins burning off at 16-18 UTC (9-11 AM local) with VFR improving from 44% to 58%. As the yellow daylight band on the chart suggests, this improvement correlates with sunrise—solar heating burns off the coastal fog a few hours after dawn.
Van Nuys Airport (KVNY) was often our planned alternate. Even though it’s just 14 miles away, its weather is consistently better than Santa Monica due to being further inland and protected from the marine layer by the Santa Monica Mountains. The predictor confirms this:
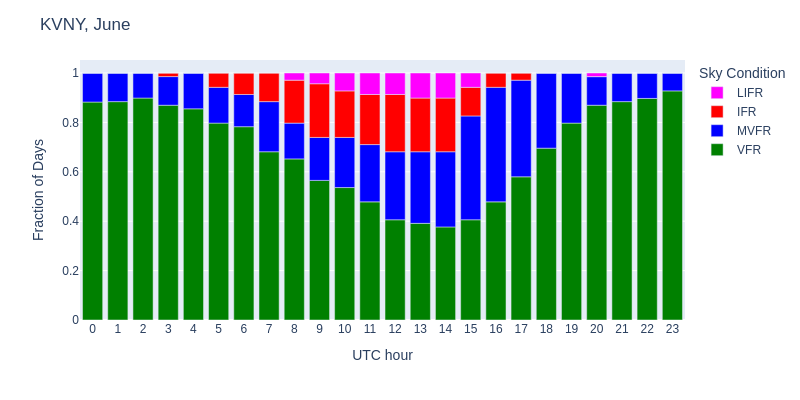
KVNY in June shows substantially better conditions. The best chance at VFR is from 19 UTC through 6 UTC (noon through 11 PM local) at 81-94%. The marine layer affects KVNY from 7-16 UTC (midnight-9 AM local), but is noticeably lighter than KSMO. At the worst hours (13-14 UTC / 6-7 AM local), VFR is still about 37-38% likely—better than KSMO’s ~26-31% chance at VFR at the same hours. This validates the local wisdom that when KSMO is socked in, KVNY is usually a safe bet.
Of course, the best way to escape June Gloom at Santa Monica is not to divert to Van Nuys, but to wait until August:
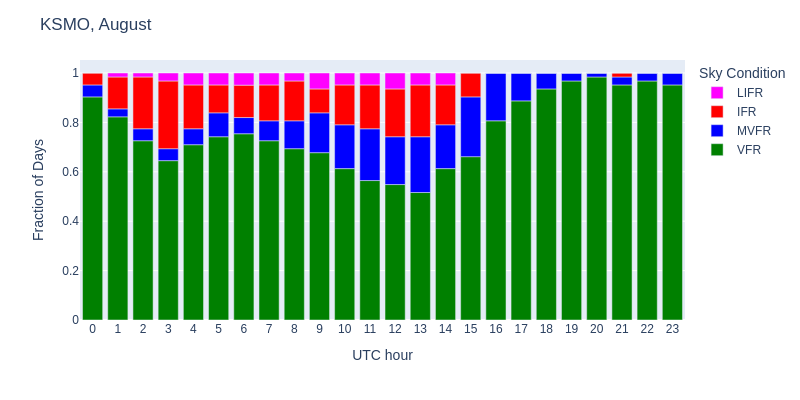
KSMO in August has much better weather than it does in June. The best VFR is from 19-23 UTC (noon-4 PM local) at 94-97%. The marine layer is much lighter and later than June, affecting mainly 10-15 UTC (3-8 AM local). At the worst hours (12-13 UTC / 5-6 AM local), VFR is still 49-54% with only a 46-51% marine layer (15-22% MVFR, 19-23% IFR, and 9-10% LIFR)—a significant improvement over June’s 26% VFR at the same hours.
How It Works
The predictor downloads several years of historical METAR data from the Iowa Environmental Mesonet ASOS network for your selected airport and month, then calculates the fraction of observations that fall into each flight condition (VFR, MVFR, IFR, LIFR) for each hour of the day. The stacked bar chart makes it easy to see patterns like morning marine layers, afternoon thunderstorms, or consistently good (or bad) conditions.
Flight conditions are determined by ceiling and visibility, with the more restrictive condition defining the overall flight condition:
| Condition | Ceiling | Visibility |
|---|---|---|
| VFR | ≥ 3,000 ft AGL | ≥ 5 statute miles |
| MVFR | ≥ 1,000 and < 3,000 ft AGL | ≥ 3 and < 5 statute miles |
| IFR | ≥ 500 and < 1,000 ft AGL | ≥ 1 and < 3 statute miles |
| LIFR | < 500 ft AGL | < 1 statute mile |
Using the Predictor
Select a month, search for an airport by its code (ICAO or IATA) or name, and click Go to view the predicted hourly conditions for that location.
The autocomplete search prioritizes exact code matches first, followed by airports whose names start with your search term. For example, typing NEW matches Lakefront Airport (KNEW) first, followed by airports whose names begin with “New” such as Newark and Newport. The search is fuzzy and typo-tolerant, so even partial or slightly misspelled queries will find relevant results.
Note: The autocomplete only shows airports that have historical METAR data available. Our database includes approximately 4,300 airports with weather data out of the 80,000+ airports worldwide from OurAirports. If your airport doesn’t appear in the search, it is likely because there’s no historical METAR data available for it from the Iowa Environmental Mesonet.